
Post
How to View Ecommerce Data in GA4
How to view ecommerce data in Google Analytics 4 to ensure that your Shopify integration is working as expected.
Kevin McLaughlin
3 min read
In this blog post, we will guide you through viewing basic e-commerce data in Google Analytics 4 (GA4). This information is relevant regardless of how you've connected GA4, be it through the SlideRule Analytics Shopify GA4 app, the built-in Shopify GA4 app, Google Tag Manager, or any other integration.
Get all the GA4 e-commerce reports you need in under a minute, directly from the Shopify admin for just $10 a month.
It is important to note that in GA4, you will not see today's data, as it takes 24 hours to process. This is different from Universal Analytics, where you could usually see all data except the last hour or so. In GA4, you can't trust the data if it's less than 24 hours old. Therefore, to test an integration, it's best to use the real-time report.
The real-time report shows users from the last 30 minutes. Use it for debugging purposes, such as checking events as they fire. Note that with the SlideRule Analytics app, purchase events in will be delayed by at least five minutes to account for upsells.

GA4 has built-in reporting available under the "Reports" section. Most e-commerce data will be found under the "Monetization" category. However, built-in reporting in GA4 is less comprehensive than Universal Analytics.
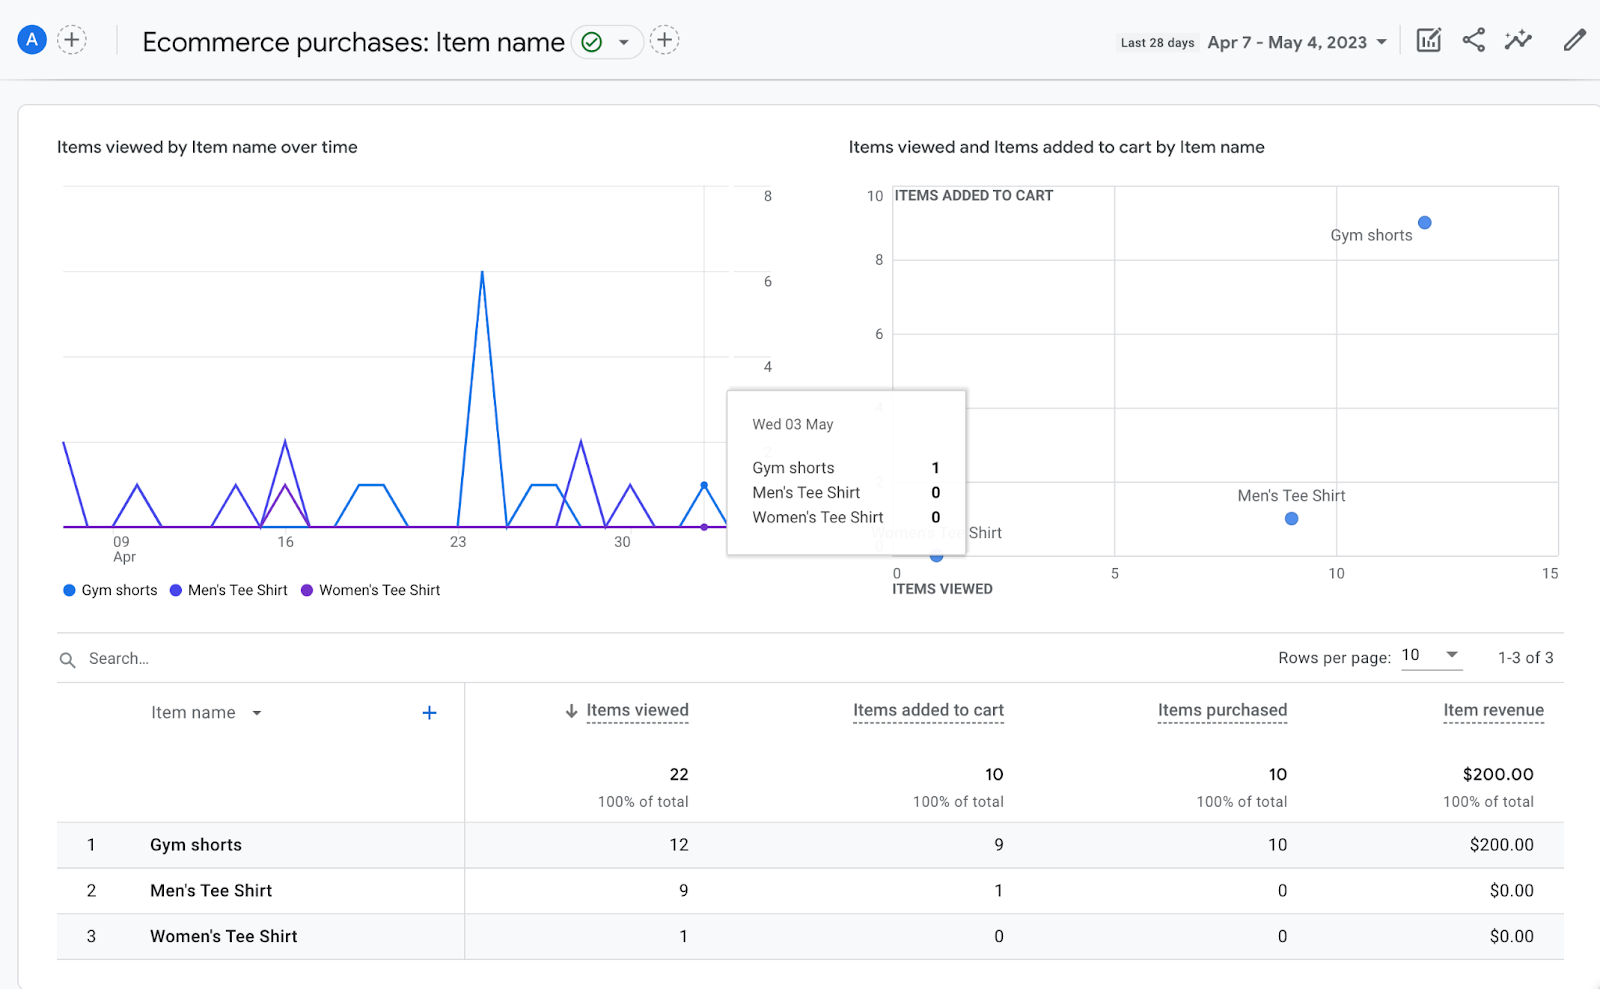
To view more detailed e-commerce data, create custom reports using Explorations in GA4. The custom reporting interface is much more powerful and versatile than Universal Analytics. You should get used to creating Explorations because that’s where the power is in GA4. We recommend starting with a blank exploration and adding the relevant dimensions and metrics, such as date, transaction ID, purchases, and purchase revenue.

Using Explorations
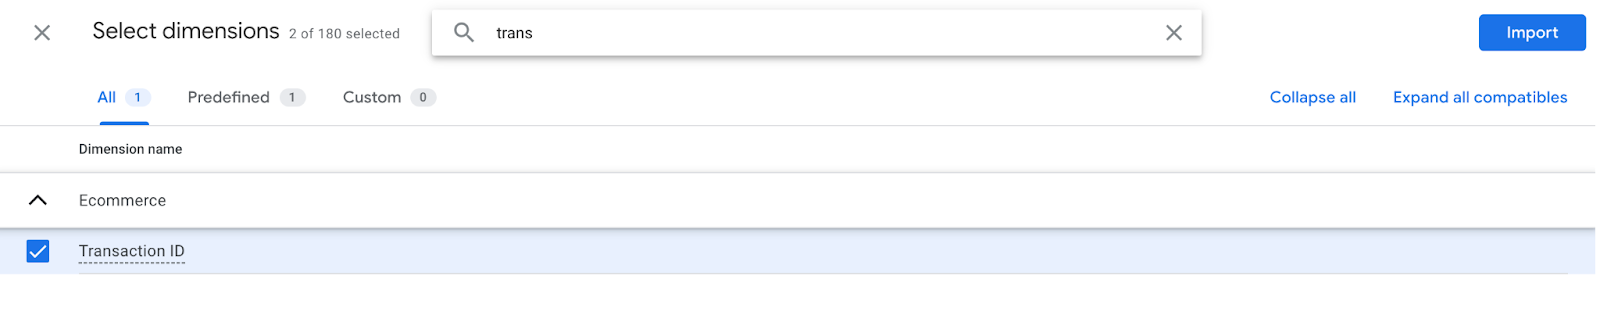
To use Explorations you import dimensions and metrics into the palette with the Plus button (the left pane),
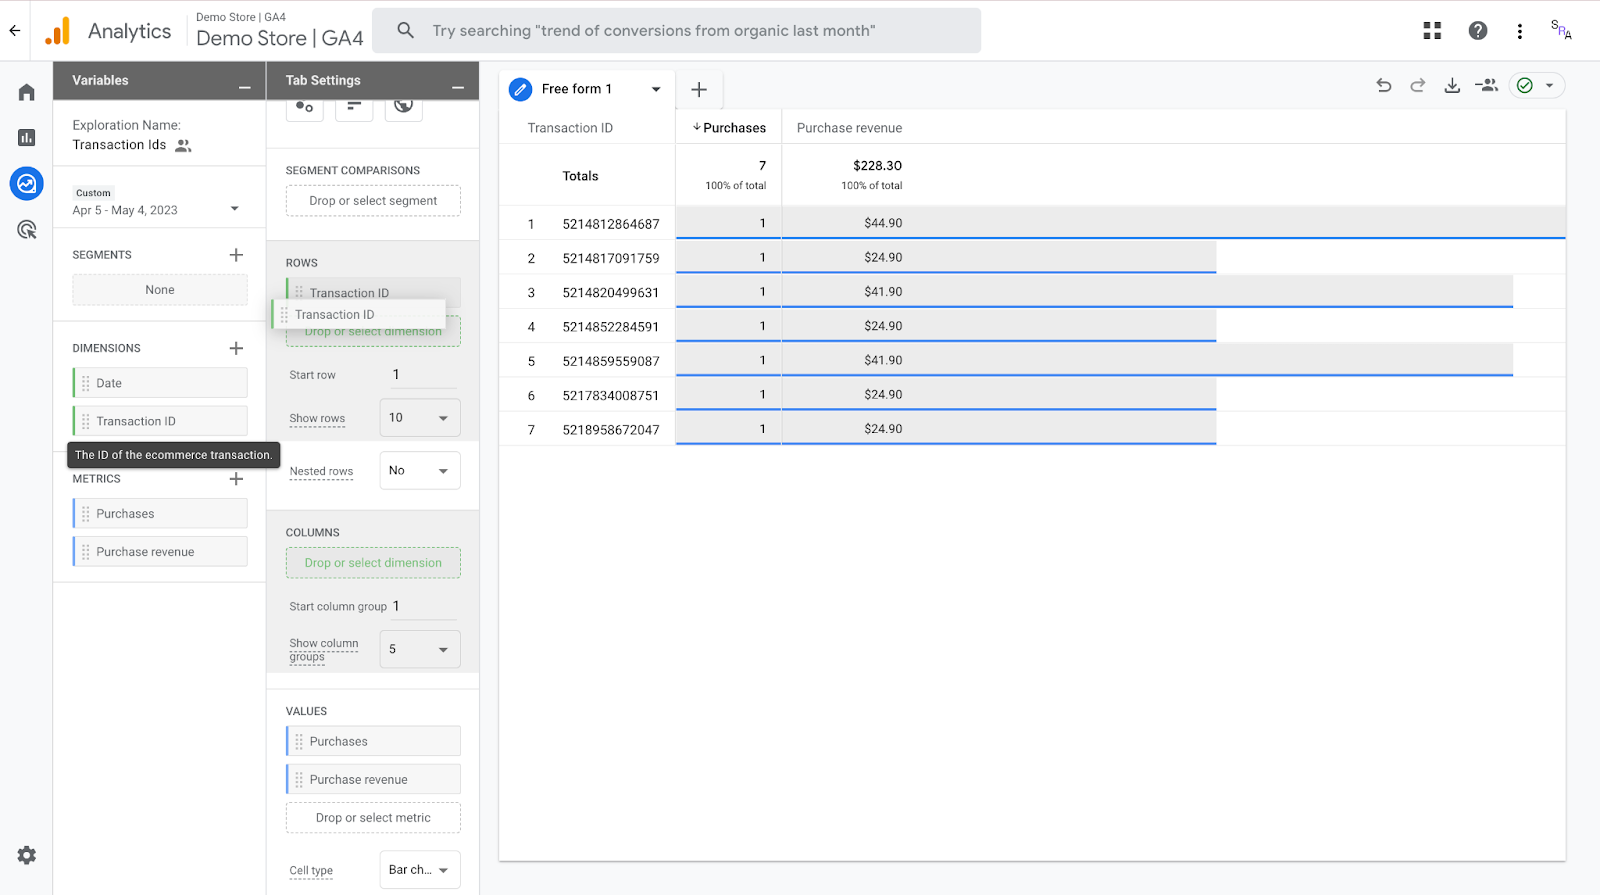
and drag those dimensions and metrics onto the canvas to create the visualization (the right pane).
You can export the data to Google Sheets for further analysis or create visualizations like line charts to better understand the data. Note that exploration reports have a two-month data limit, which hopefully will be updated by Google in the future.
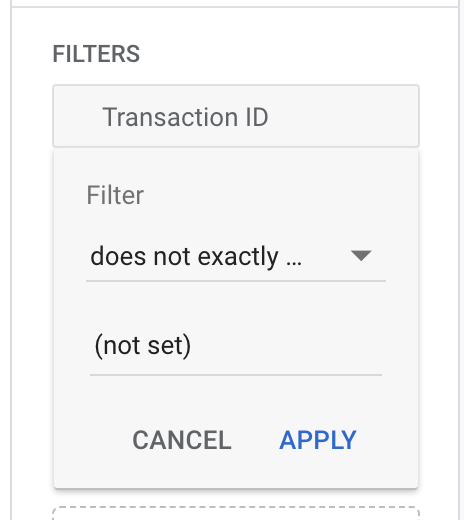
In exploration reports, you can add filters to refine the data displayed, as well as share the report with others who have access to your property.
Understanding how to view basic e-commerce data in Google Analytics 4 is crucial for monitoring your online store's performance. Remember to use real-time reports for debugging purposes and create custom reports with Explorations to gain deeper insights into your e-commerce data. Feel free to reach out if you have any questions or need help with your integration.